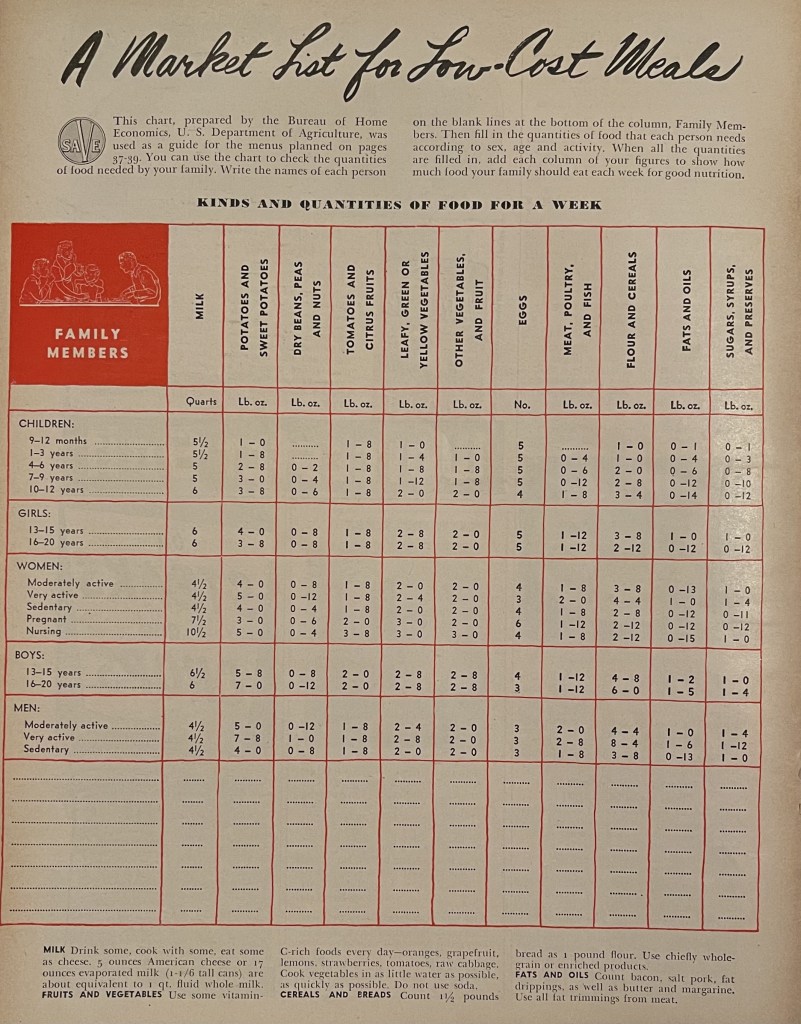
In 1942, the Bureau of Home Economics, part of the US Department of Agriculture, released this chart to help guide a home front housewife through low cost meal planning. The May 1942 issue of Woman’s Day included the chart and a week’s worth of meal plans.
Using the chart was fairly straight forward. Figure out where each of your family members fall on the chart, and use that information to help figure out the minimum amount of food each person should eat per week. This particular chart, the magazine explained, was considered Plan A. Plan A included more potatoes, dairy, and meat than Plans B or C. Plan B had more cereals and vegetables, while Plan C included more beans, fat, and eggs. A home front housewife could choose which plan best suited her family.
The meals from the May issue followed this plan, and subsequent issues featured other menus and recipes. I’d like to look at these over the next week or so. I’ll definitely try some of the recipes. I am also trying to find copies of Plans B and C since the magazine did not share those, only menus and recipes. I’ll start next week with July’s First Monday Menu. See you then!